14 Mini Apps, 13,365 KRW in Four Weeks — My Full Ad Revenue Numbers
Every in-app ad number from 14 mini apps on Apps in Toss, broken down by day and by app. 13,365 KRW over 27 days, 2,073 impressions, 6.45 KRW per impression. Why eCPM varies twentyfold between apps, why the impression leader is not the revenue leader, and what actually happened when I doubled the number of apps
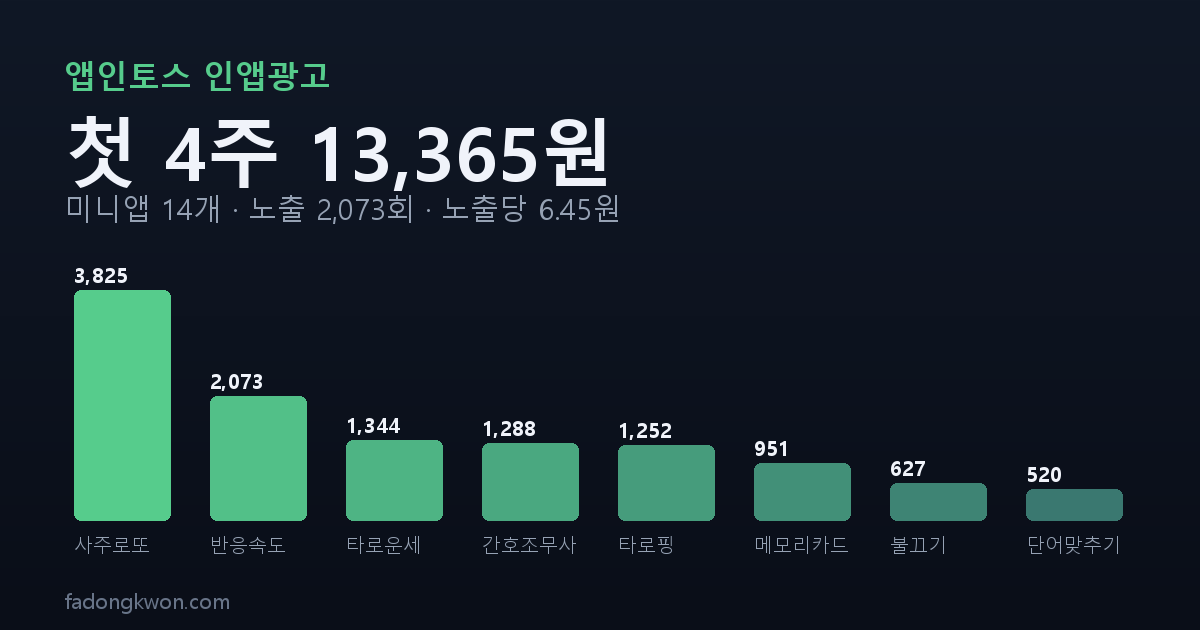
My first mini app went live on Apps in Toss on August 11. Between then and September 8 — 27 days — 14 mini apps earned 13,365 KRW in in-app ad revenue. That is about 495 KRW a day.
I am publishing the raw numbers for two reasons. First, this is exactly the figure I wanted when I started, and I could not find it anywhere. Stories about mini app earnings only circulate when they are success stories; nobody shows the dashboard of someone who just began. Second, the fact that the amount is small is itself information. Calibrating expectations works better from an ordinary case than from an exceptional one.
These numbers are Apps in Toss in-app ad (IAA) revenue. The same apps are also on Google Play, but the ad account on that side has been suspended for a month since late August, so I cannot pull those figures right now. I will write that incident up separately.
The totals
| Metric | Value |
|---|---|
| Period | 2026-08-11 – 09-08 (27 days with data) |
| Total revenue | 13,365 KRW |
| Total impressions | 2,073 |
| Overall eCPM | 6,447 KRW |
| Per impression | 6.45 KRW |
| Daily average | 495 KRW |
| Best day | August 29, 1,955 KRW |
| Zero days | 3 (Aug 13, 14, 17) |
6.45 KRW per impression. I think that is the single most useful number here, because it turns any future design decision — “what if this screen shows one more time?” — into an amount.
By app
Ordered by revenue. Each app started on a different date, so the active periods differ.
| App | First data | Impressions | Revenue (KRW) | eCPM (KRW) |
|---|---|---|---|---|
| Saju Lotto | 08-11 | 299 | 3,825 | 12,793 |
| Reaction Challenge | 08-23 | 546 | 2,073 | 3,797 |
| Tarot Fortune | 08-26 | 86 | 1,344 | 15,628 |
| Nursing Exam Bank | 08-23 | 347 | 1,288 | 3,712 |
| Tarot Ping | 08-27 | 99 | 1,252 | 12,645 |
| Memory Cards | 08-19 | 137 | 951 | 6,942 |
| All Lights Off | 09-04 | 65 | 627 | 9,646 |
| Hangul Word Guess | 09-04 | 104 | 520 | 5,001 |
| Spin the Bottle | 08-11 | 134 | 498 | 3,716 |
| Juice Spinner | 08-11 | 81 | 362 | 4,469 |
| Number Rush | 09-04 | 37 | 355 | 9,597 |
| Nonogram | 09-04 | 105 | 154 | 1,467 |
| Tap Bird | 09-04 | 15 | 101 | 6,733 |
| Sudoku | 09-04 | 18 | 14 | 788 |
Four things these numbers show
1. eCPM varies twentyfold between apps
This surprised me most. Same workspace, same ad placement setup, same SDK — and the rate per 1,000 impressions spreads this far.
- Tarot Fortune 15,628 / Saju Lotto 12,793 / Tarot Ping 12,645
- Nonogram 1,467 / Sudoku 788
The pattern is unmistakable: fortune-telling content is worth more than ten times what puzzles are worth. Which means the rate is not set by how well I built the game. It is set by what advertisers are willing to pay for the person looking at that screen. There is plenty to sell to someone checking their fortune, and not much to sell to someone solving a Sudoku grid.
So building excellent puzzle games and growing ad revenue are not necessarily the same direction — and now I have that in numbers rather than as a hunch. That does not mean I will only make fortune apps. I built Sudoku because I wanted to, and that still counts for something.
2. The impression leader is not the revenue leader
- Reaction Challenge: 546 impressions (1st) → 2,073 KRW (2nd)
- Saju Lotto: 299 impressions (3rd) → 3,825 KRW (1st)
A round of Reaction Challenge lasts a few seconds, so people replay it constantly, which is why it leads on impressions. Yet it earns less than Saju Lotto, which produced barely half as many. The eCPM gap above simply inverts the ranking.
“Build apps people come back to” is still the right goal, but it has to be read alongside the fact that returning is not the same as revenue.
3. Day-to-day swings are extreme
| Date | Active apps | Impressions | Revenue (KRW) |
|---|---|---|---|
| 08-27 | 6 | 58 | 1,670 |
| 08-28 | 8 | 84 | 714 |
| 08-29 | 8 | 158 | 1,955 |
| 08-30 | 8 | 91 | 376 |
| 08-31 | 7 | 42 | 216 |
Between August 29 and 30, impressions dropped from 158 to 91 while revenue fell from 1,955 to 376 — a fifth. On August 22 there were only 7 impressions and 622 KRW came in, which works out to 89 KRW per impression.
At low impression counts, which ads happen to win the auction moves the whole day. Any judgment based on a single day’s figure will be wrong. A week is the smallest unit I now trust.
4. Doubling the app count raised revenue by 1.5x
On September 4 I added six mini games at once, taking active apps from six or eight up to fourteen.
| Window | Days | Avg daily revenue | Avg daily impressions | Implied eCPM |
|---|---|---|---|---|
| Before 9/4 | 22 | 448 KRW | 66 | 6,788 KRW |
| From 9/4 | 5 | 701 KRW | 126 | 5,563 KRW |
Impressions nearly doubled, from 66 to 126 a day. Revenue rose from 448 to 701, or 1.56x. The new arrivals were puzzle-category apps with low eCPM, so the average rate fell from 6,788 to 5,563. Those six apps earned 1,771 KRW combined over five days.
Adding apps clearly works for growing impressions. Revenue, though, does not scale with the count — which category you add matters just as much.
How I collected this
The Apps in Toss console shows ad revenue, but once I had 14 apps, comparing them on screen became impractical. You open one app at a time and line up the date range by hand, so building a single table like the ones above means dozens of clicks.
So I switched to pulling reports through the console MCP that Apps in Toss provides and accumulating them in a CSV. It returns a per-day report for every mini app in the workspace in one call, which makes a date-by-app table a one-line command.
One thing I learned doing this: ad figures get revised over several days. The value you read yesterday for a given date differs from what you read today. So the ledger keys on (date, platform, app) and re-fetches the last two weeks every time, overwriting what is there. Record once and walk away, and you keep pre-final numbers forever.
What the money is for
A little over ten thousand won a month. I am not going to pretend this supports anyone.
It does have a designated purpose, though. Recently I removed every paid item from Hangul Monsters and Math Monsters and opened them up for free. A payment sheet standing in front of a kids’ learning app felt wrong to me, so the billing code is gone — and those two apps carry no ads either. In that post I said their running costs would be covered by ad revenue from the other apps. This 13,365 KRW is the money holding up that promise, and at this scale it covers it comfortably.
Also, Apps in Toss is closing the path where you buy traffic with promotional push, starting in October. Exposure will instead go to apps that clear a quality bar. Given what point 4 showed about the ceiling on simply adding more apps, spending the next month on the quality of each app rather than on the count looks like the right call.
I will publish the same breakdown again next month. By then the count will have grown to 26, and the effect of the policy change should be visible in the same table.
My apps are on Google Play and Apps in Toss, and some can be played right in the browser. Updates go out here and on Instagram (@fadongkwon.soft) (opens in a new tab).
The amounts above are the estimated earnings the console reports and may differ from actual settlement. The minimum payout for Apps in Toss in-app ads is 5,000 KRW.