Ad Revenue Keeps Falling After the Apps in Toss Exposure Overhaul — What Dropped Was One App's "All Tab" New Users
Around October 22, when Apps in Toss split exposure into released, recommended and boosted tiers, my Toss ad revenue fell to about 60 percent of its peak week. Breaking the ledger down across 46 apps, most of the drop came from a single app, and inside it, from new users arriving through the All tab. Here is what fell, what stayed flat, and what I am changing
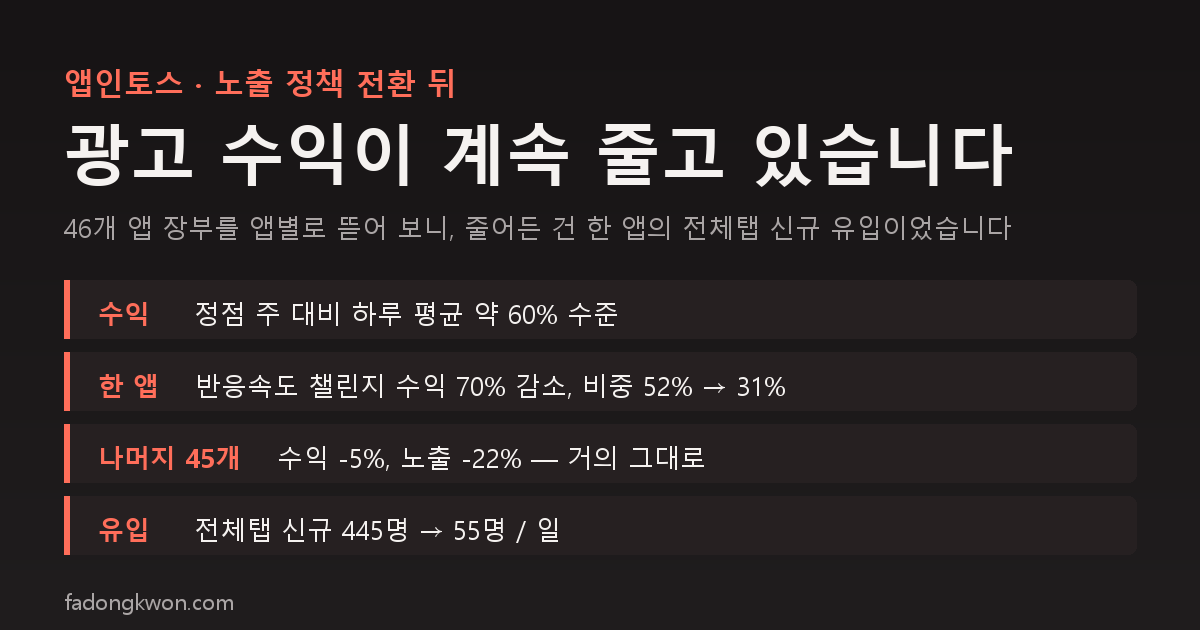
한국어로 읽기 앱인토스 노출 개편 뒤 광고 수익이 계속 줄고 있습니다 — 줄어든 건 한 앱의 '전체탭' 신규 유입이었습니다
After publishing every won of the first four weeks back in September, I decided to stop posting amounts on this blog. So every number here is a ratio or a user count. Read “revenue” as “how much, with the peak week set to 100.”
The short version: Toss ad revenue peaked in the third week of October, and the daily average is now a little over 60 percent of that peak week. Most of the drop came from one app.
Week by week
I grouped Toss ad revenue from the ledger I run daily by week and set the best week to 100.
| Week (starting Monday) | Revenue index | Share from Reaction Speed Challenge |
|---|---|---|
| Week of Sep 28 | 43 | 52% |
| Week of Oct 5 | 94 | 51% |
| Week of Oct 12 | 100 | 52% |
| Week of Oct 19 (6 days) | 55 | 31% |
The week of October 19 only has six days of data, so per day it is about 65. Narrowing further, the daily average for October 21–24 was 63 percent of the previous ten days (October 11–20).
The doubling from late September to mid-October and the decline now are both the same app. That is the right-hand column.
Where it fell: one app versus the other 45
I split Reaction Speed Challenge from the other 45 apps and compared the daily average of October 21–24 against October 11–20.
| Revenue | Ad impressions | |
|---|---|---|
| Reaction Speed Challenge | 30% | 29% |
| Other 45 apps combined | 95% | 78% |
| Total | 63% | 64% |
Reaction Speed alone dropped 70 percent; the other 45 combined dropped 5 percent. The number of apps earning anything was 46 in both periods. No app disappeared. One app shrank.
The other 45 lost 22 percent of impressions but only 5 percent of revenue. That gap is because ad rates at this scale are dominated by a handful of high-value ads, and I treat it as noise. A few apps, such as Gomoku, Sudoku and Mini Golf, actually gained impressions.
Inside Reaction Speed: what left was new users, specifically from the All tab
I looked at the console dashboard for Reaction Speed Challenge by day.
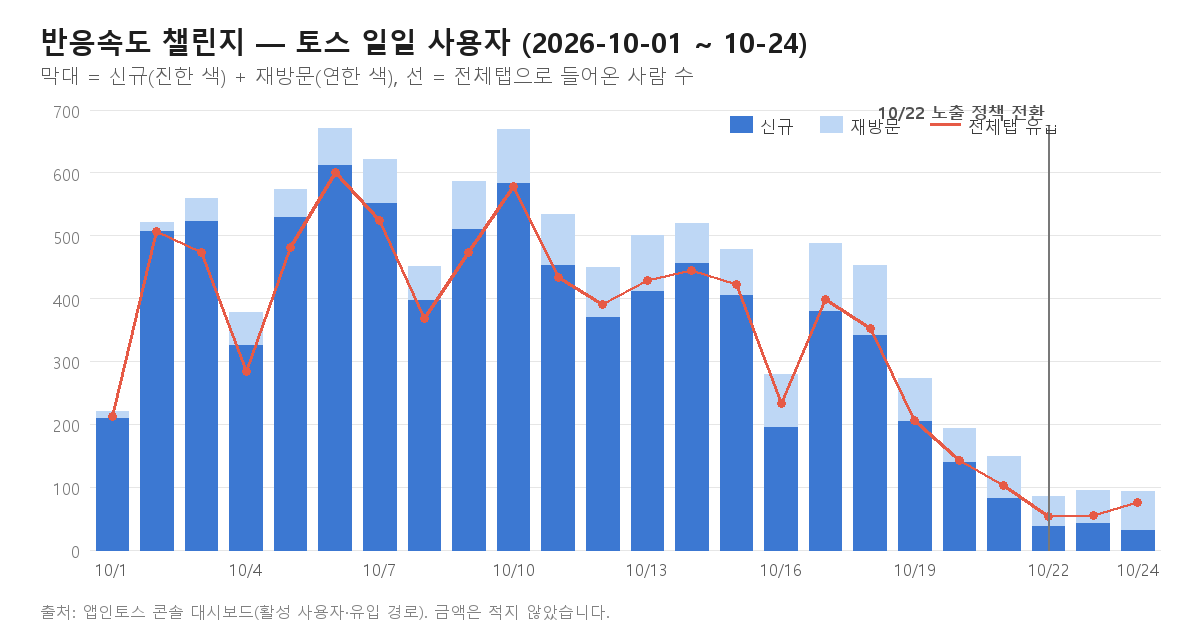 Bars are daily users (dark portion is new users); the red line is people arriving from the Toss All tab. No amounts shown.
| Oct 14 | Oct 21 | Oct 24 | |
|---|---|---|---|
| Daily users | 519 | 148 | 93 |
| New users | 456 | 82 | 31 |
| Returning users | 63 | 66 | 62 |
| Arrived from the All tab | 445 | 103 | 75 |
Returning users held steady, at 50–110 a day. What left was new users, and new users came almost entirely from the Toss All tab. 85 percent of this app’s users are teenagers.
Ad rates also held. Revenue per impression did not change; impressions fell in step with users. So this is not “ads sold for less.” It is “fewer people came in.”
The dates do not line up exactly
The policy switched on October 22, but the chart shows the decline starting on the 19th, with a one-day dip on the 16th as well. So I cannot say flatly that “the October 22 overhaul did this.” There are three candidates.
- The All-tab exposure mechanism changed gradually before the 22nd. The notice gave one date, but nothing guarantees the switch happened in a single day.
- The app’s ranking inside the All tab changed. Reaction Speed launched in August, and its All-tab traffic jumped suddenly in the week of September 28. I never knew why it rose, so it is fair that I do not know why it fell. The seven challenge modes shipped on October 14 and 17 did not move returning-user counts either way, so the update is not the cause.
- Teen exam season. With 85 percent teenagers, a midterm week could produce swings this size.
There is no way to tell which from the console. There is no screen that shows an app’s exposure tier (released, recommended, boosted), and All-tab impression counts are not available through the API. At the September webinar the answer was, in effect, “infer your tier from your referrer breakdown.”
Lining it up with the policy document
The exposure policy in effect since October 22 says:
- Released mini apps (everything that passed review): search, shared links, promotion slots
- Recommended mini apps (all four of UX, usage metrics, reviews, performance): mini app store, All tab, search priority
- Boosted mini apps (top retention and conversion within their category): Toss home, top of the All tab
The All tab belongs to recommended apps, and about 5 percent of the All tab’s recommendation traffic is reserved as a “cold start” slot for new and ordinary apps. Reaction Speed’s All-tab arrivals are not zero now; they are about one sixth of what they were. Reading that as “it did not vanish from the All tab, it dropped to cold-start level” fits the policy description. That is an interpretation, not a confirmation.
What stayed flat
- Traffic to the other 45 apps. Down 22 percent in impressions but 5 percent in revenue. These apps never relied on the All tab; they arrive through the Benefits tab (the 1-won promotion) and search.
- 1-won promotion payouts. Daily payout counts have continued without change, so the promotion is not the cause here.
- Returning users. No app, Reaction Speed included, lost returning users.
What I am changing
What this exposed is a structure where half of revenue depended on one app, and most of that app’s revenue depended on one channel (new users from the All tab). I do not control that channel, and by policy it only opens to apps with strong metrics. So the direction is not “ship more apps to fill the shelf” but “make people come back.”
- Hub apps. Bundling games of the same kind, such as puzzle, arcade and board games, into one app with a retention structure (daily missions, shared records). With the 50-app workspace limit, shipping more individual apps is hard anyway. The first hub, FDK Puzzle Cafe, went to Google Play first.
- The growth program. In the same week, Tap Bird was selected for the Apps in Toss partner growth program. Toss sends traffic and then measures whether users return, which is exactly the metric this policy asks for, so it is a chance to test it.
- Reaction Speed itself. The app is tuned for new teen arrivals, and returning users bottom out at 50–110 a day. The challenge modes added on October 14 were an attempt at retention, and the numbers do not show it yet. Next is not more modes but “a reason to come back tomorrow” (a daily challenge, a notification when your record is beaten).
Summary
- Toss ad revenue is down to a little over 60 percent of the mid-October peak week on a daily-average basis.
- Most of the drop is one app, Reaction Speed Challenge, and what left that app was teen new users arriving from the All tab. Returning users and ad rates held.
- The other 45 apps combined fell 5 percent. No app disappeared.
- The decline started three days before the policy date (October 22), and whether the cause is the policy, ranking or exam season is not something I can verify.
- The problem is revenue concentrated in one app and one channel, so the next steps are hub apps and the growth program, both aimed at retention.
In November I will fill in the same tables again and report whether it stopped at cold-start level or kept falling.
My apps are listed under GAMES and APPS, and some can be played in the browser. Updates come through this blog and Instagram (@fadongkwon.soft) (opens in a new tab).
The analysis in this post is an inference from the console dashboard and my ledger. Apps in Toss does not expose per-app exposure tiers or All-tab impression counts, so the causal link between the policy change and the revenue drop is not a confirmed fact.