Checking 27 Apps by Hand Every Morning, Until I Built a Ledger
Apps in Toss shows one app at a time, with no combined view across apps. Here is the ledger, the collector scripts and the single-file dashboard that replaced the morning clicking, and why the daily automation is still only half finished
Info
Apps in Toss shows one app at a time. With 27 apps earning, checking revenue meant opening 27 screens every morning. This is the ledger, the collector scripts and the single-file dashboard that replaced that — plus an honest note on why the daily automation is still only half done.
A Genius’s Impatience With Chores
I once read an interview with Mensa members. Asked what the brightest people have in common, the answer was not what I expected: they cannot stand doing anything twice. Rather than repeat a task, they build the thing that does it for them first.
Full disclosure — I qualified for Mensa too. I passed the test and never paid the dues, so I am not a member. Which leaves me with none of the intelligence and all of the impatience with chores. This post is about what that produced.
Checking Became a Job of Its Own
With three or four apps, opening the console and looking was fine. At twenty-seven it stopped being fine.
The Apps in Toss console shows one app at a time. To see what today earned, you open each app in turn. To compare with yesterday, you change the date and go through them again. To notice which app suddenly jumped, you repeat that twenty-seven times.
I may simply have missed it, but I could not find a screen that puts several apps side by side.
If anyone from Apps in Toss reads this: a combined view for partners running many apps would be a real help. A single table of apps by date would be enough.
What I Built
Two ledgers and one screen that draws them.
- 💰 Revenue ledger — ad revenue accumulated by date, platform and app
- ⭐ Review ledger — ratings and reviews, pulled from both Apps in Toss and Google Play
- 📊 Dashboard — a single HTML file that turns both into charts and sortable tables
Reviews are collected alongside revenue for a simple reason. On a day when earnings drop, the explanation is sometimes sitting in a one-line rating. Kept apart, the two never connect.
Decisions That Mattered
The same key overwrites. The key is date, platform and app. Ad figures get corrected a day or two later, so a value fetched once and left alone hardens while wrong. Every run therefore refetches the last two weeks and overwrites. Skipping a day heals itself on the next run.
Reviews record when they were first seen. That is the only reliable way to pick out what is new since yesterday. Reviews get edited, so the text alone will not tell you.
The dashboard is a single file. A page opened directly from disk cannot read even a CSV sitting next to it — browser security blocks it. So the data is baked into the HTML at build time. No external scripts either, which means it opens with no connection at all.
The Screens
The daily view. Bars stack each app’s revenue, and you can switch to per-app lines or a seven-day moving average.
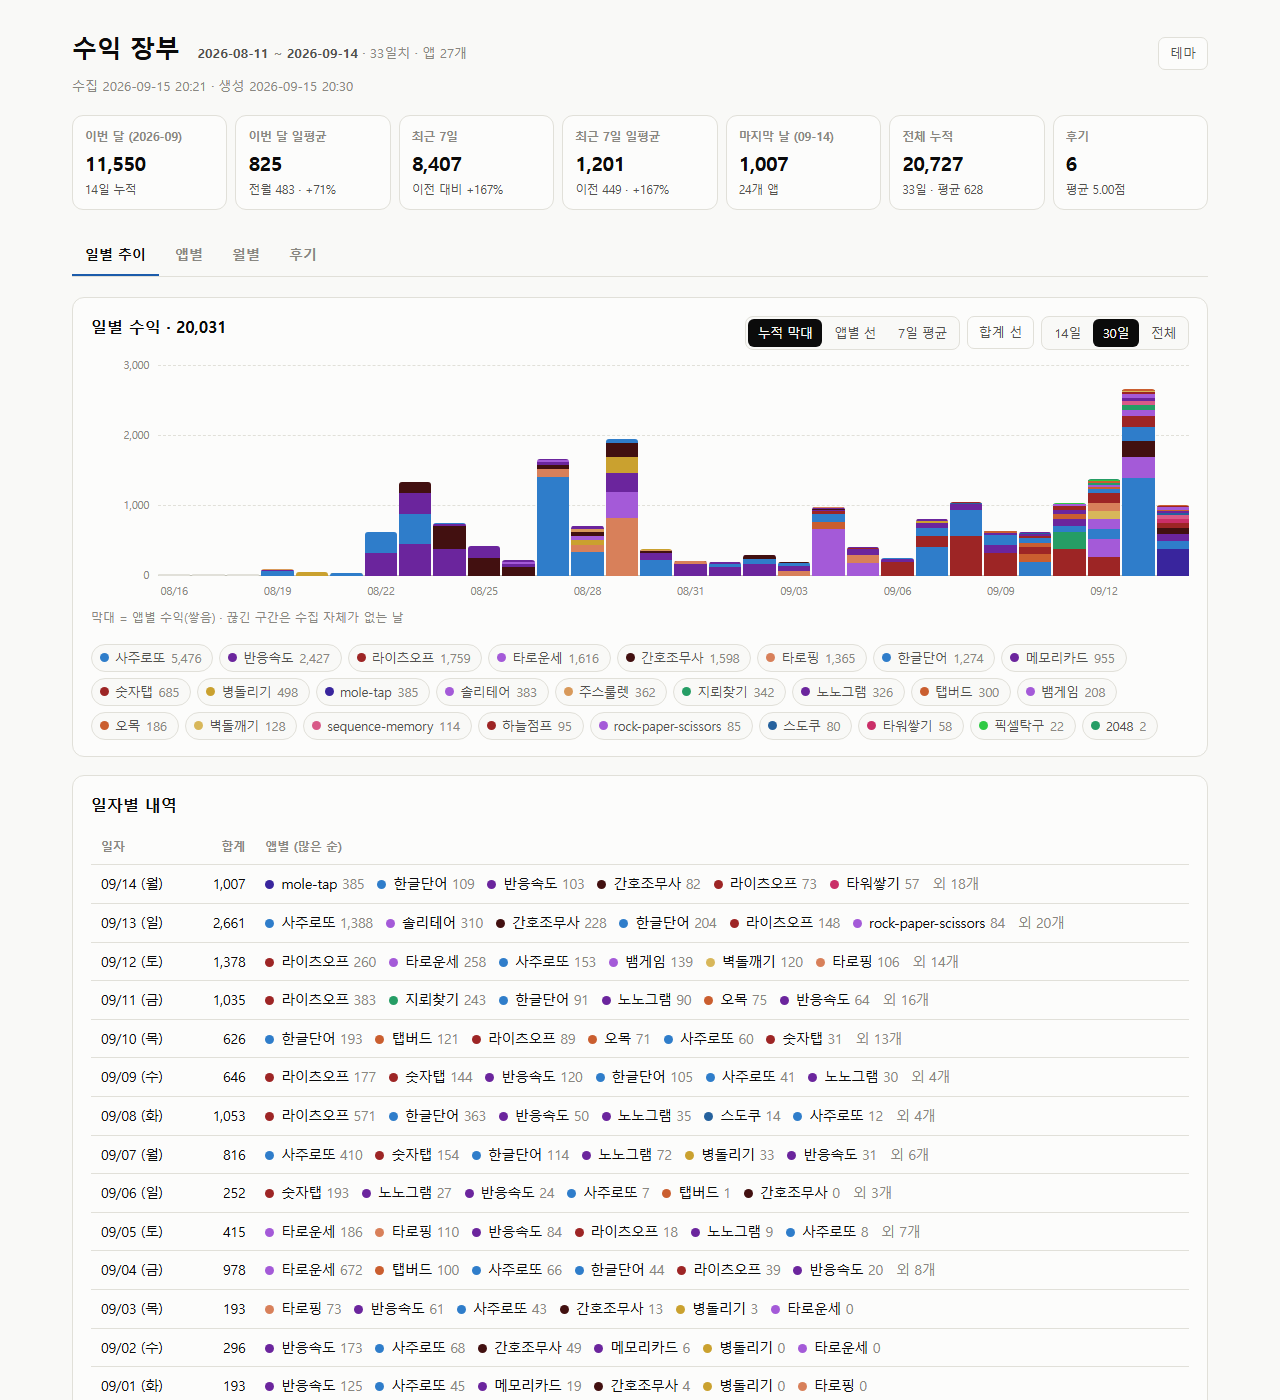
The per-app table. Share, last seven days, a thirty-day sparkline, impressions and eCPM all sit on one row, and the column headers sort.
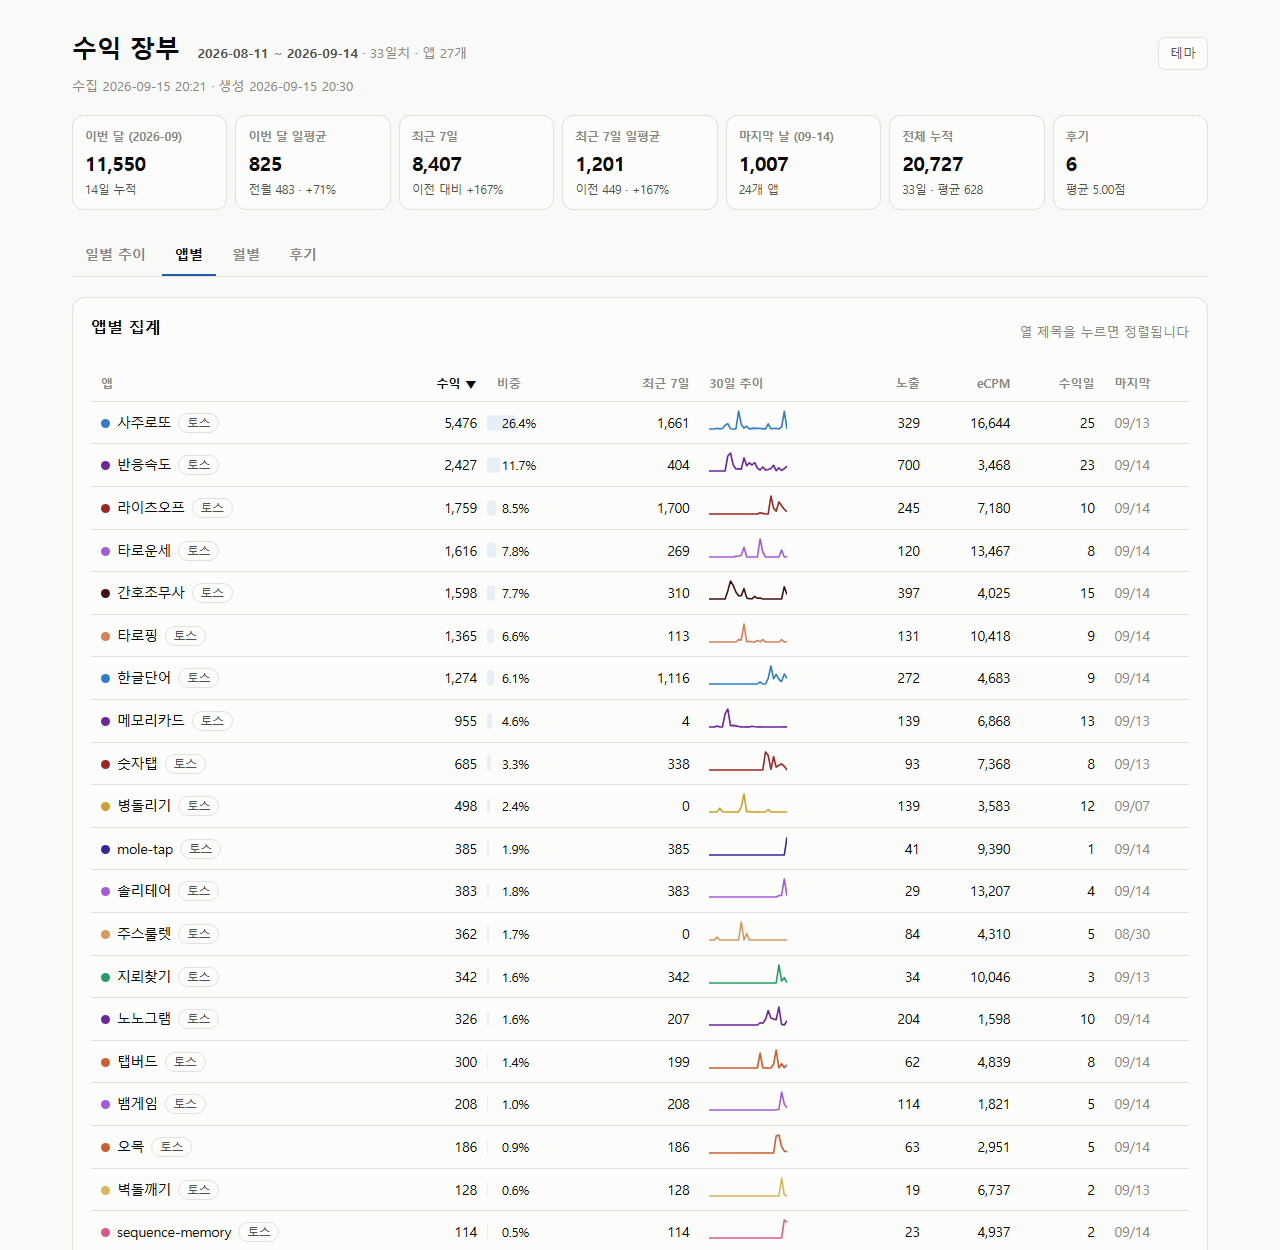
What used to take about twenty minutes each morning now takes thirty seconds.
Still Only Half Done
The goal was for this to run by itself at a set time each day. That is where it stalled.
Play reviews arrive through a service account, so they run unattended. The problem is the Apps in Toss side. Console login goes through authentication in the Toss app, which no unattended server can pass. And that is where most of the revenue data comes from.
So for now I type one command once a day. Not fully automatic, but twenty-seven rounds of clicking became one line, which is most of what I wanted.
The rest will go to this machine’s task scheduler. Running it where the login is already alive makes the authentication problem disappear.
The Numbers Are Elsewhere
This post is about the tool, so it skips the earnings themselves. Actual amounts and the spread between apps are in Four Weeks of Ad Revenue From 14 Mini Apps, Fully Disclosed.
I post updates here and on Instagram (@fadongkwon.soft) (opens in a new tab).