Correcting My October Toss Revenue Analysis — It Was Not a Decline, an 18-Day Spike Had Ended
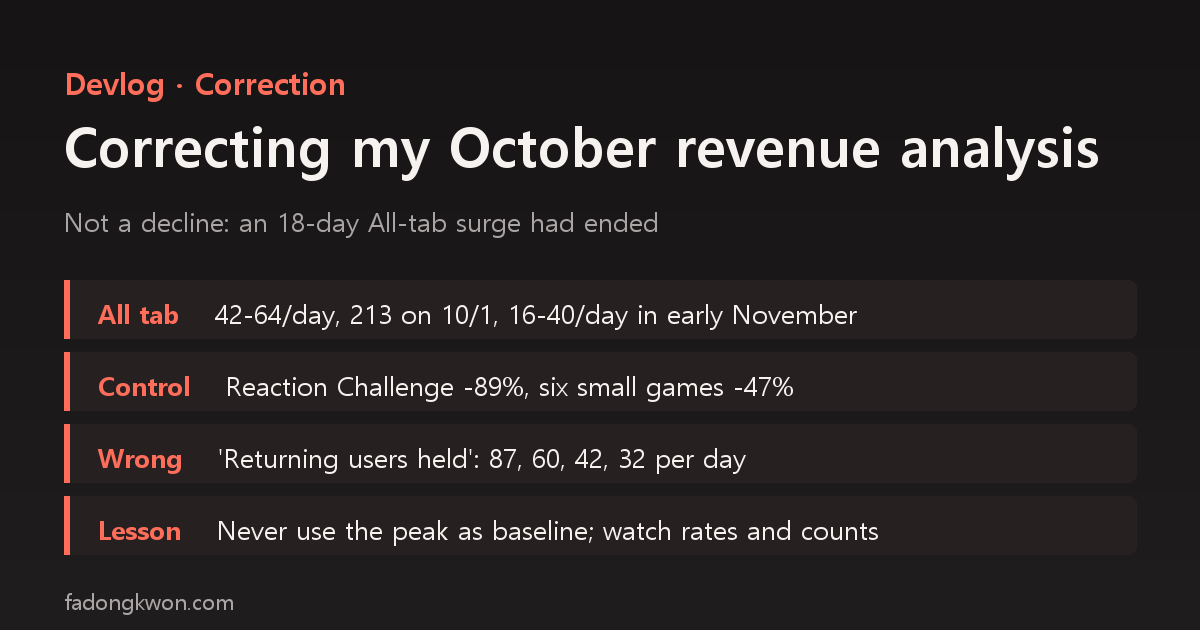
On October 25 I described my falling Toss ad revenue as one app losing its All-tab new users while returning users held steady. Adding two more weeks of data on November 6 changed the picture: Reaction Challenge had mostly returned to its late-September level after an 18-day All-tab surge that began on October 1, and the claim that returning users held steady was wrong. Here are the rejected hypotheses and their evidence, the sentences I got wrong, and what I still do not know, all dated
한국어로 읽기 10월 토스 수익 감소 분석을 정정합니다 — 줄어든 게 아니라 18일짜리 급증이 끝난 것이었습니다
On October 25 I published Ad revenue keeps falling after the Apps in Toss exposure overhaul and ended it by promising to “fill in the same table again in November.” This post is the interim report on that promise, and also a correction of that post. When I reran the analysis on November 6 with two more weeks of data, the framing of the conclusion changed and one sentence turned out to be plainly wrong.
As usual on this blog, there are no amounts here. The numbers are user counts, ratios, and an index with a reference week set to 100. I am also not drawing conclusions about November as a whole here. That will be a separate post once the month is over.
What the October 25 post said
In short:
- Toss ad revenue had fallen to a little over 60 percent of its peak week on a daily-average basis.
- Most of the drop came from a single app, Reaction Challenge, and what it lost were teenage new users arriving through the All tab.
- Returning users and ad rates had not changed.
- The drop began three days before the exposure policy switch on October 22, and there was no way to tell whether the cause was the policy, the app’s All-tab ranking, or exam season.
I was careful not to name a single cause, but the title and framing were “falling after the exposure overhaul.” And “returning users have not changed” was stated as fact.
On a second look: not a decline, a return to where it was
For the November 6 rerun I changed the baseline. The October 25 post set the peak week, October 12, to 100 and measured how far things had come down. This time I laid out All-tab inflow day by day starting in late September, before the surge.
| Period | Reaction Challenge All-tab inflow (per day) |
|---|---|
| 9/28–9/30 | 42–64 |
| 10/1 | 213 |
| 10/2–10/18 | 380–600 |
| 10/19 · 10/20 · 10/21 · 10/22 | 206 · 143 · 103 · 54 |
| 10/25–11/5 | 16–63 (16–40 in the first week of November) |
The shape is clear. All-tab inflow jumped fivefold in a single day on October 1, stayed high for 18 days, then faded over four days from October 19. The first week of November is similar to, or a little below, late September. The October 25 post said inflow “suddenly rose from the week of September 28”; by day, it started exactly on October 1.
By week it looks like this. Revenue is Reaction Challenge’s daily average as an index, with the week of October 12 = 100.
| Week (from Monday) | Daily revenue index | Avg daily users | Weekly new users | All-tab per day | Returning per day | Teen share | Share of all Toss revenue |
|---|---|---|---|---|---|---|---|
| 9/28 | 43 | 264 | 1,719 | 233 | 19 | 84.4% | 51.8% |
| 10/5 | 93 | 587 | 3,635 | 494 | 67 | 86.9% | 51.0% |
| 10/12 | 100 | 453 | 2,560 | 382 | 87 | 81.5% | 51.5% |
| 10/19 | 39 | 143 | 579 | 102 | 60 | 78.3% | 29.3% |
| 10/26 | 12 | 70 | 194 | 42 | 42 | 69.3% | 7.6% |
| 11/2 (4 days) | 10 | 61 | 116 | 29 | 32 | 60.5% | 5.6% |
Even inside the week of September 28, the 28th–30th and October 1–4 are different. Taken alone, those first three days have a daily revenue index of roughly 6–18, and today’s 10–12 sits inside that range. “Back to where it was before the surge” describes it better than “down to 60 percent of the peak.”
The values for the week of November 2 were collected on the morning of November 6, so November 5 was still provisional. Toss posts each day’s ad revenue progressively until 10 a.m. the following day, so I deliberately left out anything from the most recent day or two.
Was it only Reaction Challenge?
If the drop in All-tab traffic were a change across all of Toss, other games should have fallen by a similar amount. So I took six small games of comparable size (2048, Sky Jump, Number Rush, Mole Tap, All Lights Off, Brick Breaker) as a comparison group and compared weekly unique All-tab users.
| App | Week of 10/12 | Week of 10/26 | Change |
|---|---|---|---|
| Reaction Challenge | 2,417 | 257 | -89% |
| Six small games combined | 169 | 90 | -47% |
The other apps did lose All-tab traffic too. But they started at 10 to 40 users a week and lost about half. Reaction Challenge went from about 2,400 a week to 250, a 90 percent drop. A large fall unique to Reaction Challenge sat on top of a common decline. Gomoku and Tap Bird, which entered a growth program in the same period, had program traffic spilling into the All tab, so I left them out of the comparison.
Crossing off hypotheses one by one
| Hypothesis | Verdict | Evidence |
|---|---|---|
| The All-tab exposure Reaction Challenge had been getting ended | supported (inferred) | the two tables above; a four-day stepwise fade looks more like a ranking slipping than a switch being flipped (inference) |
| The October 22 exposure policy switch | not what started it | the drop began on 10/19, three days before the policy date, and by 10/22 All-tab traffic was already -88% versus 10/14 (445 → 54) |
| Teen midterm exams | rejected | from the week of 10/12 to 10/19, teens fell 71% and adults (20+) fell 64%, in the same week at similar rates; teens did not come back in November after exams ended |
| An app defect or release | rejected | last release on 10/17, nothing since; first-week return rate 5.4–5.8% for the 10/5, 10/12 and 10/19 cohorts alike; page views per user unchanged |
| Ad placement problems | rejected (at placement level) | all three placements in normal state with no abuse flags; interstitial impressions per user unchanged through October |
| Changes in benefits-tab 1-won promotion traffic | small contributing factor | down a little, but about 5 percent of the All-tab drop |
| A competing app | cannot verify | no way to read other workspaces’ metrics or All-tab rankings |
Of the three candidates the October 25 post left open, exam season is now crossed off. If adults dropped in the same week at the same rate, exams cannot be the main cause.
The policy switch stays on the list, but differently. It is not what started the drop; the dates do not line up. Under the new policy, though, the All tab belongs to “recommended mini apps,” and the recommendation criteria include real-usage metrics such as return rate. With a first-week return rate of 5.4–5.8 percent, Reaction Challenge is unlikely to qualify, so the policy may be why it has not climbed back since the exposure ended. That is an inference, because there is no screen that shows an app’s tier.
The most important limitation also remains. Which surface Toss used to show Reaction Challenge from October 1 to 18 (ranking, the recommendation area, or the slot for new apps) cannot be checked through the API. So the verdict above is not proof but the explanation that best fits the data I have. The only way to confirm it is to ask Toss directly.
What I got wrong
Here are the corrections, dated.
| Sentence in the October 25 post | What the November 6 data shows |
|---|---|
| “Returning users are unchanged”, “no app lost returning users” | Wrong. Reaction Challenge’s returning users (daily average) went 87 → 60 → 42 → 32 from the week of 10/12 |
| “Toss ad revenue is down to a little over 60 percent of the peak” (the decline framing) | Reaction Challenge is closer to returning to its late-September level after an 18-day surge ended |
| “All-tab inflow suddenly rose from the week of September 28” | by day, it started on October 1 |
| “Ad rates were unchanged too” | the interstitial rate was about 33 percent lower in 10/26–11/5 than in 10/5–18; most of the drop was still fewer impressions (fewer users), with the rate adding only part |
| Three candidate causes (policy, ranking, exams) | exams rejected, policy did not start it, end of All-tab exposure fits best |
The first row is the correction that stings. The reason it was wrong is also clear. On October 25 the drop was less than a week old, and the people returning at that point were mostly new users from the surge. Returning users ultimately come from new users. When new users fall to a tenth, the number of returning users follows them down over several weeks even if the return rate stays the same. On October 25 I missed that lag; I saw a few flat days of absolute numbers and wrote “unchanged.”
What happened on the other side
Over the same period, total Toss ad revenue did not fall as much as I feared. From October 26, Gomoku and Tap Bird were in a growth program that brought in a lot of traffic, and revenue from every app other than Reaction Challenge was 52 percent higher in the week of October 26 than in the week of October 12. Working it out from the ledger, total Toss revenue was about 80 percent of the October 12 week.
As a result, Reaction Challenge’s share fell from 51.5 percent in the week of October 12 to 7.6 percent in the week of October 26. Breaking up a structure where one app carried half the revenue is a good thing, but this too came from a temporary inflow, so the same trap now sits on the other side. The growth program budgets ran out on November 5 for Gomoku and November 6 for Tap Bird. What happens after that is a question for the November wrap-up.
What I still do not know
- Which surface the October 1–18 exposure came from, and what it takes to get it again.
- Whether the policy switch is what keeps it from recovering. There is no screen showing an app’s tier.
- How November as a whole ends: total Toss revenue after the growth programs, and where Reaction Challenge’s returning users level off. I will cover that with the same tables once the month is over.
What I learned
- Do not use the peak as the baseline. The October 25 post set the best week to 100 and asked “how far did it fall?” If that peak was a temporary surge, coming down from it is a return, not a decline. The baseline should have been taken from before the surge.
- Look at rates and absolute counts together. The return rate held, but the number of returning users was shrinking. Look at only one and you reach the opposite conclusion. Right after new users change sharply, the absolute count lags by weeks.
- A framing can assert what the text avoids asserting. I kept the cause carefully open, but the title and the table were already framed as a “decline.” I should have chosen the baseline before choosing the frame.
- Do not use recent values that are not final yet. On a platform where yesterday’s revenue keeps updating until 10 a.m. today, yesterday’s number is not a number yet.
- Correct your own posts, with a date. I did not quietly edit the old post. I added a dated correction notice at its top linking here. Keeping a record of which sentence was wrong, and when, makes the next analysis less wrong.
I gathered the data and tested the hypotheses with AI agents for this rerun; the verdicts and which sentences to correct were my calls.
My apps are listed under GAMES and APPS. Updates are posted on this blog and on Instagram (@fadongkwon.soft) (opens in a new tab).
The causal verdicts in this post are inferences from the console dashboards and my ledger. Apps in Toss does not report which surfaces an individual app was shown on or how often, so the end of All-tab exposure is not an established fact but the explanation that best fits the current data.