Three Weeks After the Hub Switch — I Refilled the Same Table, Everyone Shrank Together, and Return Visits Are Still Too Small to Read
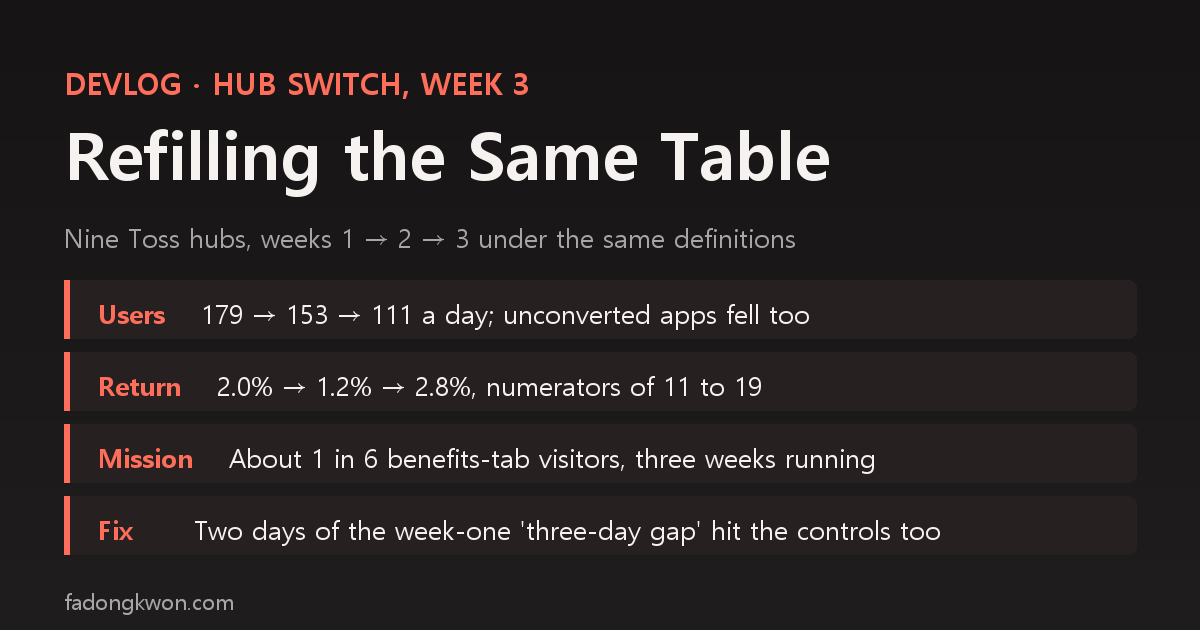
On October 26 I turned nine existing Apps in Toss mini apps into hubs, and in the week-one post I promised to refill the same table at week three. Using the same definitions, daily users went from 179 in week one to 153 in week two and 111 in week three, but apps I never converted dropped by a similar amount. Next-day return moved 2.0%, 1.2%, 2.8%, with numerators of only 11 to 19 people, so it has no direction yet. Ad impressions per user rose again on the game hubs, mostly because of one hub, and only about one in six benefits-tab visitors still finishes the mission. A control group also showed that half of my week-one explanation for the three-day dip after the switch was wrong
한국어로 읽기 허브 전환 3주차 — 같은 표를 다시 채웠더니 사용자는 같이 줄었고, 재방문은 아직 말할 수 없는 크기였습니다
At the end of the week-one post on the hub switch I wrote that I would refill the same table in mid-November. This is that table. The switch happened on October 26, and I am writing this in the early hours of November 19, so two more weeks have piled up since week one.
The short version: three weeks of numbers say less than I hoped. Users went down, and telling whether that was the hubs or Toss itself needed a control group. Return visits move by a handful of people, so they cannot be read as a direction. What I did find is that one explanation in the week-one post was wrong.
As before, there are no money amounts here. Only user counts, ratios, ad impression counts and mission payout counts.
How I measured it again
The definitions are the same as in week one. On Apps in Toss a hub is an existing app whose app info and bundle were replaced, so the same app identifier (miniAppId) carries the before and the after as one continuous line. I pulled the same nine identifiers with the same dashboard metrics.
| Period | Dates | Note |
|---|---|---|
| Week before | Oct 19–25 | Values from the week-one post as published |
| Week 1 | Oct 27–Nov 2 | Values from the week-one post as published (queried Nov 3) |
| Week 2 | Nov 3–9 | Queried just after midnight on Nov 19 |
| Week 3 | Nov 10–16 | Queried just after midnight on Nov 19, with two exceptions |
The two exceptions:
- November 10 is missing from the active-user series in the console. All nine hubs, and the control apps below, have no November 10 row in the active-user data, even though the referrer breakdown and the retention cohorts for that date exist. Re-fetching with the refresh option changed nothing. So week three’s daily users, benefits-tab share and ad impressions are computed over six days, November 11–16.
- November 17 and 18 are not used. The Toss console fills in the previous day’s data gradually until 10 a.m. the next day and keeps correcting it for a few days after that. So week three’s next-day return uses the cohorts that arrived November 10–15. The next day of the November 16 cohort is November 17, which is not final yet. It is the same treatment the week-one post gave the November 2 cohort.
The aggregation works the same way as in week one: daily values from the console are copied into a script and summed per period. These are the lines that matter.
1
2
3
4
5
6
7
8
9
10
11
W2  = ['11-03', '11-04', '11-05', '11-06', '11-07', '11-08', '11-09']
W3  = ['11-10', '11-11', '11-12', '11-13', '11-14', '11-15', '11-16']
W3A = W3[1:]   # Nov 10 active users are missing, so DAU and impressions use 6 days
C3  = W3[:-1]  # next-day return cohorts Nov 10-15 (Nov 17 not final)

def S(d, days):
    return sum(d.get(k, 0) for k in days)

dau_w3   = S(au, W3A) / len(W3A)
d1_w3    = S(d1_numerator, C3), S(first_entry, C3)   # (numerator, denominator)
imp_user = S(impressions, W3A) / S(au, W3A)
Ad impressions come, as in week one, from the ledger where I record the in-app ad report every day. Right after the switch that ledger counted some days twice because of a naming problem; that story and the cleanup are in a separate post, and the rows used here (November 3 onward) are post-cleanup.
At a glance
| Hub | Daily users (week before → W1 → W2 → W3) | Benefits-tab share (W1 → W2 → W3) | Next-day return (W1 → W2 → W3) |
|---|---|---|---|
| FDK Puzzle Cafe | 20 → 16 → 14 → 10 | 87% → 91% → 88% | 1/77 → 0/92 → 0/58 |
| FDK Brain Check | 27 → 19 → 16 → 12 | 80% → 79% → 70% | 1/94 → 1/95 → 1/53 |
| FDK Arcade | 2 → 21 → 16 → 14 | 75% → 74% → 62% | 1/116 → 2/98 → 3/71 |
| FDK Board Duel | 21 → 14 → 14 → 9 | 74% → 79% → 65% | 2/75 → 0/85 → 2/54 |
| FDK Olympics | 26 → 25 → 25 → 20 | 57% → 52% → 35% | 6/102 → 6/124 → 8/68 |
| FDK Lucky Lab | 1 → 15 → 14 → 10 | 92% → 87% → 88% | 1/91 → 0/91 → 0/55 |
| FDK Daily Quiz | 1 → 27 → 19 → 15 | 96% → 94% → 95% | 3/160 → 0/131 → 1/99 |
| FDK Lucky Pick | 1 → 23 → 19 → 12 | 89% → 86% → 88% | 4/137 → 2/114 → 2/75 |
| FDK Exam Bank | 3 → 19 → 16 → 11 | 92% → 92% → 89% | 0/110 → 0/97 → 0/67 |
| 5 game hubs total | 95 → 95 → 86 → 63 | 73% → 72% → 59% | 11/464 (2.4%) → 9/494 (1.8%) → 14/304 (4.6%) |
| 4 non-game hubs total | 5 → 85 → 67 → 47 | 92% → 90% → 90% | 8/498 (1.6%) → 2/433 (0.5%) → 3/296 (1.0%) |
| All 9 | 100 → 179 → 153 → 111 | 19/962 (2.0%) → 11/927 (1.2%) → 17/600 (2.8%) |
For next-day return, the denominator is the users who first arrived that week (the inflow cohort) and the numerator is how many of them came back the next day. The week-one cells are copied from the numbers published on November 3; I did not re-query them. Console values get corrected over a few days, so a fresh pull today could differ slightly.
Users dropped, but not only on the hubs
Daily users across the nine went from 179 in week one to 153 in week two and 111 in week three, 38% below week one. All nine dropped, game and non-game alike.
On its own that reads like “the hub effect spiked in week one and faded”. So this time I did something I skipped in week one: I pulled the same periods for apps that were never converted and have had the same one-won promotion since early October. Those are the board games Yut Nori and Janggi. Both get 60–90% of their users from the benefits tab, so their traffic looks like the hubs’.
| App | W1 | W2 | W3 (6 days) | W3 vs W1 |
|---|---|---|---|---|
| 9 hubs total | 179 | 153 | 111 | -38% |
| Yut Nori (not converted) | 35 | 28 | 22 | -38% |
| Janggi (not converted) | 19 | 23 | 18 | -9% |
From week two to week three alone, the hubs fell 28%, Yut Nori 22% and Janggi 23%. It was not just the hubs; apps that depend on the benefits tab shrank together. The more natural reading is that fewer people came in through the benefits tab in the second week of November. Nothing in this table supports “the hub effect wore off”.
I do not know why benefits-tab traffic dropped. Around the same time Toss reorganized mini app categories into three levels on November 2, and the ranking tab moved to the new categories on November 3. On the ad side, Toss had announced that its native-ad logic improvement would roll out from early November, starting with placements that have no policy violations. I found nothing tying either one directly to benefits-tab traffic, so I only note that the timing overlaps.
The game hubs’ benefits-tab share falling from 73% to 59% belongs to the same story. It fell because benefits-tab traffic shrank first, not because other channels grew. Olympics, which fell the most (52% → 35%), actually gained a little from the all-apps tab, from 48 users a week in week two to 59 in week three (seven days), while its benefits-tab users went from 92 to 49 a week.
One confounder: the Gomoku growth program
Board Duel includes Gomoku. During this period the standalone Gomoku app was picked for Toss’s growth program and received its own benefits-tab “browse a mini app” traffic from October 26, until the program used up its budget on November 5. People who open the standalone Gomoku app see the hubs at the top of its “you might also like” list.
So Board Duel’s week-one and week-two numbers may include people who came over from standalone Gomoku, and its week-three drop (14 → 9) may include the end of that flow. These tables cannot separate it. The dashboard’s referrer breakdown only has benefits tab, all-apps tab, search, mini app home, push and other, with no separate path for arriving from another mini app. I am writing up the growth program results separately, so here it stays a named confounder.
Return visits: too small to call a rise
This was the number I most wanted in week one, and it still is.
| Group | Week before | W1 | W2 | W3 |
|---|---|---|---|---|
| 5 game hubs | 13/597 (2.2%) | 11/464 (2.4%) | 9/494 (1.8%) | 14/304 (4.6%) |
| 4 non-game hubs | 0/33 (0.0%) | 8/498 (1.6%) | 2/433 (0.5%) | 3/296 (1.0%) |
| All 9 | 13/630 (2.1%) | 19/962 (2.0%) | 11/927 (1.2%) | 17/600 (2.8%) |
The game hubs’ 4.6% in week three looks like double. But the numerator is 14 people, 8 of them on Olympics and 3 on Arcade. In a week where the denominator shrank to 304, a few more people came back the next day. In week two it went the other way, to 1.8%. The all-nine line, 2.0% → 1.2% → 2.8%, is the same story. A ratio whose numerator moves between 11 and 19 people cannot support “the hubs raised return visits”.
I also refilled the other angle from week one: users in a day who were not first-time visitors that day, summed per week.
| Group | Week before | W1 | W2 | W3 (6 days, 7-day equivalent) |
|---|---|---|---|---|
| 5 game hubs, returning users | 69 | 103 | 105 | 88 (103) |
| Share of daily users | 10% | 16% | 18% | 23% |
| 4 non-game hubs, returning users | 4 | 26 | 38 | 24 (28) |
On the game hubs the returning-user count has stayed at a little over 100 a week since week one, and only its share rose as daily users fell. One reading is that even as fewer new people arrive, some of those who came once keep coming. But as the week-one post said, this also includes users from before the switch carried over on the same identifier, so I still cannot say “they stayed because of the hub”.
Ad impressions: up again on the game hubs, mostly one hub
| Group | Week before | W1 | W2 | W3 (6 days) |
|---|---|---|---|---|
| 5 game hubs, impressions per user | 1.3 | 2.8 | 2.7 | 4.2 |
| 4 game hubs without Olympics | 2.2 | 2.6 | ||
| Olympics | 1.1 | 3.5 | 3.8 | 7.7 |
| 4 non-game hubs | 1.6 | 1.8 | 1.5 | 1.5 |
Impressions per user on the game hubs reached 4.2 in week three. Most of that is Olympics alone, jumping from 3.8 to 7.7; without it the other four went from 2.2 to 2.6. On November 7 I sent Olympics a bundle with a seventh event (Wobbly Baseball) for review, and the bundle changed a few more times after that. I have no per-event breakdown of impressions, so I could not tell whether the rise belongs to the new event or to the remaining users simply playing longer.
The non-game hubs have stayed at 1.5–1.8 impressions per user for three weeks. The week-one observation holds: checking a fortune or solving a few questions and leaving is a usage pattern the hub did not change.
Still about one in six finishes the mission
As in week one, the hub promotion’s mission is “play any one game in the hub” (each non-game hub has its own single action). I took the cumulative payout counts from the console’s promotion list on November 3 (the week-one post) and late on November 18, and subtracted to get the share for weeks two and three.
| Group | Payouts (Nov 3 → Nov 18) | W2–W3 payouts | Benefits-tab users, same period (Nov 3–16) | Ratio |
|---|---|---|---|---|
| 5 game hubs | 84 → 199 | 115 | 699 | about 1 in 6 |
| 4 non-game hubs | 86 → 190 | 104 | 753 | about 1 in 7 |
Payouts run through the night of November 18 and traffic through November 16, so the periods do not line up exactly. The payout side is two days longer, which pushes the ratio slightly high. Even so, it clearly has not improved on week one’s “one in six”. Most people who tap the benefits-tab card leave from the hub’s first screen or game list.
Correcting one explanation from the week-one post
The week-one post had a section on “the three-day gap after the switch”. Hub traffic bottomed out on October 26–28 and jumped back on the 29th, and I explained it as the gap between the old promotions ending and the new hub promotions starting to circulate as benefits-tab cards. I also wrote that next time the new promotion should go up first and the old one should end later.
While pulling the control group I looked at the same dates, and the same trough shows up in apps that had nothing to do with the switch.
| App | Oct 26 | Oct 27 | Oct 28 | Oct 29 |
|---|---|---|---|---|
| Janggi (promotion unchanged since Oct 7), benefits-tab users | 11 | 4 | 3 | 18 |
| Yut Nori (promotion unchanged since Oct 7), daily users | 25 | 17 | 46 |
Janggi’s benefits-tab users were 10–17 a day on October 24–25, dropped to 3–4 on the 27th and 28th, and came back to 18 on the 29th. Nothing about its promotion or bundle changed. So at least the two-day bottom on October 27–28 came from the benefits tab, not from the hub switch. Half of the week-one explanation was wrong, and the lesson “put the new promotion up first” rested on weaker evidence than I thought. On October 26 itself the hubs were lower than the controls, so the switch day may still have had a share of its own.
I could have done this comparison in week one. Looking only at the apps you changed, before and after, credits everything that happened to the whole platform on those days to your change.
What changed after week one
Four more Toss hubs
After week one, four more hubs went up through the same “change app info” route, each taking over an existing app’s slot. They are under two weeks old, so they are not in the main table; here are their daily users only.
| Hub | App it replaced | Live | Daily users before | Daily users Nov 11–16 | Benefits-tab share |
|---|---|---|---|---|---|
| FDK Quiz Fest | Daily Korean History (no promotion) | Night of Nov 7, promotion on Nov 9 | 0.8 | 12.8 | 90% |
| FDK Monsters | Spin the Bottle (no promotion) | Night of Nov 9, promotion at the same time | 0.6 | 9.0 | 85% |
| Weekend Life | Car Number Lotto (had a promotion) | Night of Nov 9, promotion restarted afternoon of Nov 10 | 18.2 | 8.0 | 92% |
| FDK Siege | Castle Topple (had a promotion) | Morning of Nov 10 | 13.8 | 7.7 | 87% |
The “before” column is the average from October 27 until just before the switch (through Nov 8 for Quiz Fest, Monsters and Siege; through Nov 7 for Weekend Life).
The week-one pattern repeats. Slots that had no promotion (Quiz Fest, Monsters) got their first one-won mission with the switch and went from under one user a day to around ten, with 90% arriving through the benefits tab. Slots that already had a promotion (Weekend Life, Siege) went down. But the controls also fell 20–30% that week, so I do not know how much of those two drops belongs to the switch. Weekend Life had a short bottom of 3–4 users a day on November 8–9 and Siege had 2 users on November 9, while the controls were normal on those days. I did not find the cause.
A “get reminders” chip on the hub home
On the night of November 3, when I wrote the week-one post, I saw that the non-game hubs had zero functional-push consents and added a “get a reminder every evening at 8” chip to the hub home. People who arrive once from the benefits tab never reach the consent prompt inside a game, so the chip lets them opt in from the home screen, and the hub asks once when they return home after finishing a mission. The live bundles of eight of the original nine hubs (all but Exam Bank) were built after that change, so they include the chip. Exam Bank uses a different screen frame, and I did not confirm whether the chip is in it.
I cannot measure the effect yet. I found no console value that directly counts consenting users, and the cumulative send count per template is consenters multiplied by days, which is hard to turn back into a consenter count. Visits recorded with the referrer “push” totaled five across the nine hubs from November 3 to 16. Meanwhile I found and fixed hub pushes still going out under the old apps’ names, which is in another post.
What the week-one post promised
The week-one post ended with three items.
| Promise | Now |
|---|---|
| Refill the same table at week three in mid-November | This post. Because of the Nov 10 gap and the unfinished Nov 17–18, week three uses six days |
| Move the Card Games hub into Solitaire’s Toss slot | Not done yet. The Card Games hub is still Play-only, and Solitaire on Toss is still a standalone app |
| Decide on a path that sends benefits-tab visitors straight into a first game, after the Gomoku results | Not done yet. The hub shell has no such path, and the “one in six” above is unchanged |
Summary
What three weeks of numbers can say:
- Daily users on the nine hubs went 179 (week one) → 153 → 111, but promotion apps that were never converted also fell more than 20% from week two to week three. There is no basis for reading the drop as the hub effect wearing off.
- The week-one observation that converting a slot with no promotion produces around ten users a day, thanks to its first one-won mission, held for two new hubs as well.
- About one in six benefits-tab visitors finishes the mission, three weeks running.
- Ad impressions per user on the non-game hubs stayed at 1.5–1.8 for three weeks.
- At least October 27–28 of the week-one “three-day gap” also appeared in apps unrelated to the switch.
And what they cannot say:
- Whether next-day return rose because of the hubs. The numerators behind 2.0% → 1.2% → 2.8% are 11 to 19 people.
- Whether the rise in impressions per user on the game hubs belongs to Olympics’ new event.
- How much of Board Duel’s drop comes from the end of the Gomoku growth program.
- How much of the post-switch drop at Weekend Life and Siege is the switch versus the overall benefits-tab decline.
- Whether the “get reminders” chip increased consents.
What I learned
- Keep one unchanged app next to any before-and-after comparison. Pulling just two apps with similar traffic was enough to correct an explanation in the week-one post. It is the cheapest way to separate what happened to the whole platform from what my change did.
- Treat a missing day as missing, not as zero. When a whole date drops out of a dashboard, as November 10 did here, filling it with zero drags the weekly average down. I left the day out, averaged the rest, and wrote the number of days in the table.
- Write ratios with their numerators. 4.6% and 14 people are the same number, but they read with very different weight. For apps with a few dozen daily users, showing the numerator alone prevents a lot of overstatement.
An AI agent handled the console queries and the aggregation, and the definitions and interpretation were kept aligned with the week-one table. Every number here was obtained by read-only queries.
The apps I’ve made are under GAMES and APPS, and some can be played right in the browser. News goes out on this blog and on Instagram (@fadongkwon.soft) (opens in a new tab).
The week-two and week-three numbers in this post were queried from the Apps in Toss console dashboards just after midnight on November 19, 2026; the week-before and week-one values are the November 3 numbers published in the week-one post. November 10 active-user values are missing from the console, so week three is computed over the six days November 11–16, and values from November 17 onward were not used because they are not final. Console figures are corrected over several days and may change slightly later.