Growth Program Results — 43,000 People Came In; a Week Later, 1% Still Visit Gomoku and 0.1% Tap Bird
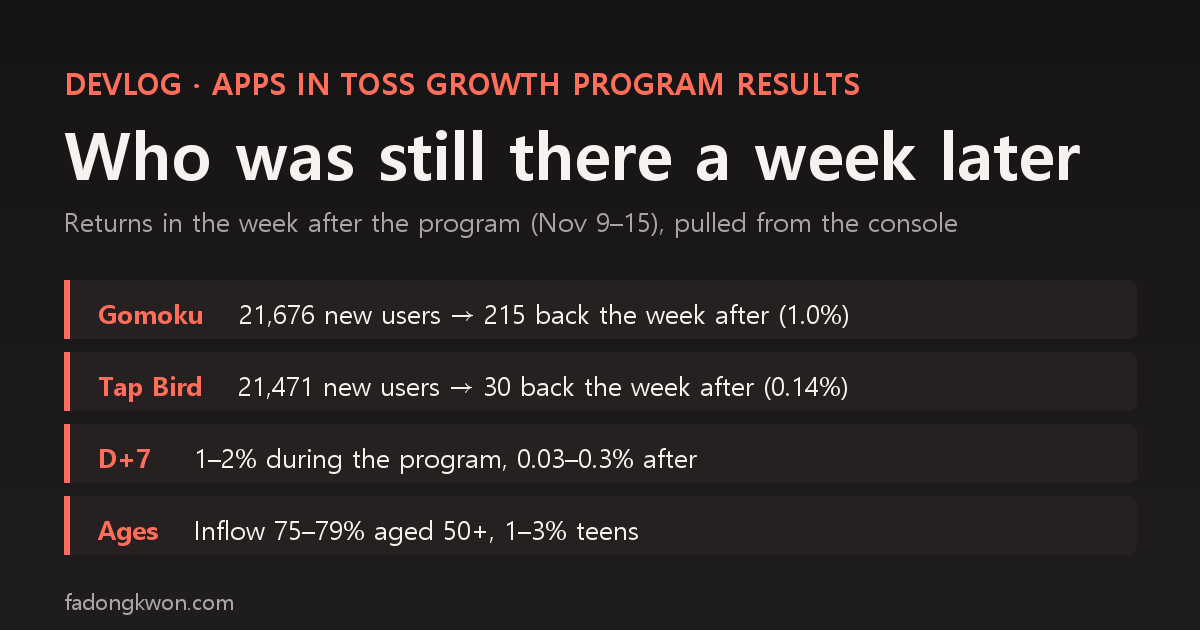
Through the Apps in Toss partner growth program, Gomoku and Tap Bird each received more than 20,000 new users over about eleven days. As promised, I pulled the return numbers from the console dashboards a week after the promotion ended. Of the users who first arrived during the program, 215 (1.0%) came back to Gomoku in the week after it ended, and 30 (0.14%) to Tap Bird. The D+7 boundary shows that returns during the program were driven by the reward. This post compares the results to the baseline and covers the age mismatch, the landing screen that was fixed too late, and the metrics I could not recover
한국어로 읽기 성장 프로그램 결과 — 4만 3천 명이 들어왔고, 일주일 뒤 오는 사람은 오목 1%, 탭 버드 0.1%였습니다
In late October I wrote two posts about Tap Bird and Gomoku being picked for the Apps in Toss partner growth program. Toss runs a “browse for 10 seconds, get 5 won” promotion in its Benefits tab, sends people to the app, and then watches whether they come back after it ends. Both posts closed with a promise: once a week had passed after the promotion, I would report how many people returned. Here are the results.
I pulled every number myself from the Apps in Toss console dashboards (active users, retention, sessions, in-app ad report) around midnight on November 19. Toss fills in each day’s data gradually until 10 a.m. the following day, so I do not treat the values for November 17 and 18 as final. Every period in the tables below ends on November 16.
The short version
| Item | Gomoku | Tap Bird |
|---|---|---|
| Program period | Oct 26 11:00 – Nov 5 10:53 (about 10 days) | Oct 26 11:00 – Nov 6 19:16 (about 11 days) |
| New users in that period | 21,676 | 21,471 |
| Came back in the week after (Nov 9–15) | 215 (1.0%) | 30 (0.14%) |
| Weekly return before the program (Oct 12 and Oct 19 week cohorts) | 9.8%, 14.6% | 6.3%, 10.0% |
Between the two apps, a little over 43,000 people came in, and 245 of them opened the app again in the week starting a week after the end. The end time is when the campaign status flipped to stopped in the console, which is when the budget ran out. My first post said “about a week,” and I later revised that to several weeks; in the end it took ten and eleven days.
“New users” is the dashboard’s own new-user count. It is not a number isolated to program traffic but everyone who arrived for the first time in that period. Still, 90% (Gomoku) to 98% (Tap Bird) of entries in that period came through the Benefits tab, so in practice it is program traffic. “Came back” comes from weekly retention: week 2 of the Oct 26 week cohort plus week 1 of the Nov 2 week cohort. Both fall on the same week, November 9–15, and the cohorts do not overlap, so they can be added.
Daily users: back to normal the moment it ended
| Period | Gomoku daily users (avg) | Tap Bird daily users (avg) |
|---|---|---|
| Before (Oct 12–25) | 82–133 (101) | 20–50 (32) |
| During (until the day before the budget ran out) | 1,003–3,264 (2,262) | 754–2,756 (1,772) |
| First week after | 140–197 (161) — Nov 6–12 | 13–39 (25) — Nov 7–13 |
| After that (to Nov 16) | 145–191 (170) — Nov 13–16 | 12–20 (16) — Nov 14–16 |
The dashboard’s daily user value for November 10 is missing for both apps, so I left that day out of the averages.
Tap Bird went from 3,453 users to 39 the day after the budget ran out (Nov 7), and it is now below its pre-program level. Gomoku settled about 70 users a day above where it was before.
I split Gomoku’s gain by where it came from.
| Gomoku | New (daily avg) | Returning = total − new (daily avg) | All-tab entries (daily avg) |
|---|---|---|---|
| Before (Oct 12–25) | 70 | 31 | 35 |
| First week after (Nov 6–12) | 59 | 102 | 97 |
| After that (Nov 13–16) | 81 | 89 | 110 |
New users stayed flat, while returning users went from the low 30s to 90–100 a day. By week, Gomoku had 778 weekly users in the week of November 9: 499 new and 279 returning, and 215 of those 279 came from the program cohorts. In the two weeks before the program, returning users numbered 67 and 90. What Gomoku kept is roughly 200 people who come at least once a week.
Tap Bird had 108 weekly users that same week, 43 of them returning. The two pre-program weeks had 30 and 28 returning, so it grew only by about the 30 program-cohort users. Daily users actually dropped because new users fell from 23 a day to 6–10. I could not confirm the cause from this pull.
The D+7 boundary: in-program returns were driven by the reward
Daily retention asks whether someone who first arrived on a given day came back N days later. I split the cohorts by whether their D+7 day fell inside or outside the program.
| Cohort (first-visit date) | Where D+7 falls | Gomoku D+7 | Tap Bird D+7 |
|---|---|---|---|
| Before the program (Oct 12–25) | Before / early in the program | 29/973 = 3.0% | 7/320 = 2.2% |
| Early in the program | Still during the program | 72/4,065 = 1.8% (Oct 26–28) | 69/5,797 = 1.2% (Oct 26–30) |
| Late in the program | After the program ended | 48/15,987 = 0.3% (Oct 30–Nov 5) | 5/15,674 = 0.03% (Oct 31–Nov 6) |
Gomoku’s Oct 29 cohort has its D+7 on the day the budget ran out (Nov 5), so I left it out of both rows (17/1,624).
These are the same kind of people. When the promotion is still live on their D+7, 1–2% come back; when it has ended, only 0.3% and 0.03% do. For Tap Bird that is five people out of 15,000. Most returns during the program were not for the game but for another 5 won. One person could claim the reward twice a day, six hours apart, so D+1 and D+7 inside the program cannot be separated from people re-claiming the reward.
D+14 falls after the program for every cohort from Oct 26 to Nov 2: Gomoku 24/15,233 = 0.16%, Tap Bird 3/11,668 = 0.03%. Pre-program cohorts were at 3.1% and 1.9%.
The baseline in the Gomoku post was “next-day return of 0.8% for Benefits-tab users before the program.” The program cohorts’ D+1 was higher, at 2.5% for Gomoku and 1.5% for Tap Bird, but for the reason above that number cannot be read as what the game held on to. What can be compared with the Tap Bird post’s baseline of 8.7% weekly return is the weekly figure after the program ended: 0.14%.
Sessions and ads: the people who stayed use the apps like regular users
| Avg session (sec) | Before | During | First week after | After that (to Nov 16) |
|---|---|---|---|---|
| Gomoku | 192 | 54 | 238 | 188 |
| Tap Bird | 51 | 24 | 64 | 57 |
| Ad impressions ÷ daily users | Before | During | First week after | After that (to Nov 16) |
|---|---|---|---|---|
| Gomoku | 2.77 | 1.27 | 4.18 | 3.42 |
| Tap Bird | 2.04 | 1.10 | 2.18 | 2.55 |
During the program, Tap Bird’s average session was 24 seconds. The reward paid out after 10 seconds, so many people left right after that. Once the program ended, sessions went back to pre-program levels, and Gomoku’s ad impressions per user rose above where they had been. In the event log, Gomoku after the program logs 800–1,400 game-start events a day, roughly 7 games per daily user (Nov 6–16). The 200 who stayed are not drop-ins; they play Gomoku.
The ages did not match
| Age share (weekly users) | Before (Oct 12–25) | During | Week after (Nov 9–15) |
|---|---|---|---|
| Gomoku, teens / 50+ | 26% / 53% | 3% / 75% (week of Oct 26) | 36% / 42% |
| Tap Bird, teens / 50+ | 36% / 57% | 1% / 79% (Oct 26–Nov 8) | 33% / 54% |
Three quarters of the program traffic was 50 or older, and there were almost no teenagers. Tap Bird is a reflex arcade game, and more than a third of its pre-program users were teens. Both apps received the same age mix, yet a week later 1.0% remained with Gomoku and 0.14% with Tap Bird, a sevenfold difference. The numbers alone cannot prove the cause, but whether the incoming people fit the game appears to have made a large difference in how many stayed.
This campaign was created by Toss, so I could not choose the audience (age or new-user targeting). The only thing I could change in the console was the landing screen.
The landing screen was only right by the third night
Both earlier posts said I had reworked the first screen so that a game would be visible within 10 seconds. Going back through the records, program users actually saw that screen only from the bundle released at 21:20 on October 28.
- Gomoku’s new screen went live on October 27, but
?from=growthwas added to the campaign’s landing path only at 18:22 that day. On top of that, the entry check that reads this value had a bug, so the home screen still opened. The bundle that fixed it went out at 21:20 on October 28. - Tap Bird’s bundle that sends first-time promotion users straight into their first flight, skipping the home screen, went out at the same time.
The new users from October 26–28, 4,065 for Gomoku and 3,086 for Tap Bird, saw the old first screen or the home screen. Later cohorts do have slightly higher D+1 (Gomoku 2.2% to 2.6%, Tap Bird 0.9% to 1.9%). But that is D+1 inside the program, so I cannot tell whether it came from the landing screen or from people re-claiming the reward.
What I could not measure
- First-game start rate and second-game start rate. These were two of the three metrics I named in the Tap Bird post. The console’s event log query only returns the last 14 days, so only values from November 6 onward remain, and I could not recover the daily values for the program period. Custom values in that period were also being silently dropped by a log-format bug, and from October 28 program users started a game directly without the home screen, so a “start rate” no longer means anything.
- Return by entry path. The dashboard has retention by entry path, but I could not confirm how its cohorts are defined (first entry path, or returns counted only through the same path), so I left it out of this post.
- Why Gomoku’s All-tab entries rose. They went from 35 a day before the program to around 100 after it, and the teen share rose too. I do not know whether that relates to program-cohort returns or to a change in exposure on Toss’s side. The 300 daily users on November 17 (237 from the All tab) are also not final.
The cluster of one-star reviews during the program is covered in the post about showing the rating prompt only after a win, and how Toss revenue overall looked in that period is in the correction to my October revenue analysis.
What I learned
Only what the numbers say.
- In-program return rates do not predict the outcome. When D+7 fell inside the program it was 1–2%; outside, 0.03–0.3%. To judge this kind of “browse and get paid” traffic, look only at returns that land after the program has ended.
- Whether the incoming people fit the game comes first. From the same mostly-50-plus traffic, Gomoku kept seven times as many. If you cannot choose the audience, you should first ask whether the app suits that age group and shape the first screen for them.
- Check the first screen before the start, through the real entry path. This time it was only right by the third night, and more than 7,000 people went through in the meantime. The entry-check bug would have been caught by verifying the screen that actually opened rather than a passing check.
- Save the measurements yourself during the program. The console’s event log stops returning daily values after 14 days. By the time I sat down to write this post, two of the promised metrics could no longer be pulled.
What remains is Gomoku’s 200-odd weekly visitors and the extra games they play. Set against the 43,000 who passed through, it is a small number, and that is as far as the current data honestly goes.
I pulled the numbers and assembled the tables with an AI agent, and I chose the interpretation and conclusions after looking at the raw data.
My apps are listed under GAMES and APPS, and some can be played right in the browser. Updates are posted on this blog and on Instagram (@fadongkwon.soft) (opens in a new tab).
The figures were pulled from the Apps in Toss console dashboards around midnight on November 19, 2026. Toss data can be revised for several days, and values from November 17 onward are not final. Retention cohorts are “users who first arrived that day (or week),” not a number isolated to program traffic.